

Today is a major day for all financial markets as the U.S. Federal Reserve holds its meeting to announce the latest interest rate decision. Investors around the world are watching closely, as this decision could shape the direction of global markets in the coming weeks.
Along with this, the S&P 500 has reached a new all-time high, reflecting strong investor confidence and market momentum. In this blog, I’ll cover the key updates, market reactions, and what this means for traders and investors moving forward. Make sure to read the full post for a complete analysis.
S&P 500 All Time High
The S&P 500 (^GSPC) reached an all-time closing high of 6,890.89 on October 28, 2025, marking its 34th record close of the year. As of the latest available data on October 29, no new high has been confirmed for that day, with markets showing a slight +0.23% gain in after-hours trading.
1. Recent Performance: The index has been on a strong upward trajectory in 2025, driven by robust corporate earnings, AI sector growth, and favorable economic policies. However, analysts note elevated valuations, with the index trading above Tech Bubble levels on multiple metrics.
2. Historical Note: This surpasses the previous all-time high from earlier in 2025, reflecting continued market optimism despite headwinds like trade tensions and potential economic slowdowns.
USA Interest Rate Decision
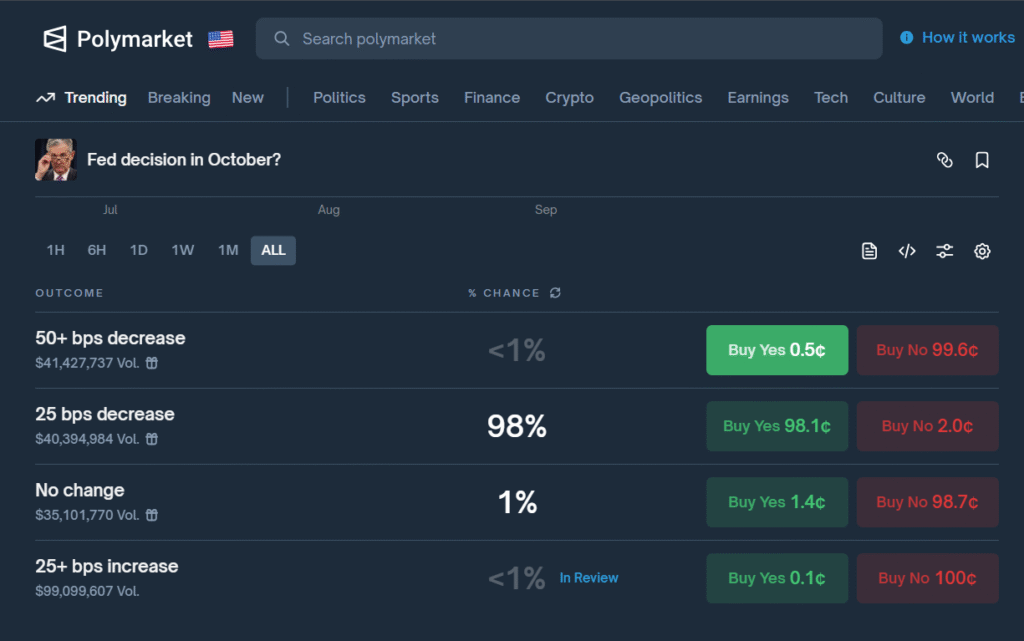
The current U.S. interest rate stands at 4.25%, while the forecast is 4.0%, which means the Federal Reserve is expected to cut rates by 0.25%. In the previous meeting held in September, the forecast was also 4.25%, and the Fed followed through with the predicted rate cut, as many analysts expected. Now, all eyes are on the upcoming decision — if the Fed decides to cut rates by more than 0.25%, it would be seen as a very bullish signal for all major markets, including stocks, forex, and cryptocurrencies.
According to Polymarket, one of the largest prediction platforms, there is a 99% chance that the Fed will cut rates by 0.25% this time as well.
BTC OG Holders
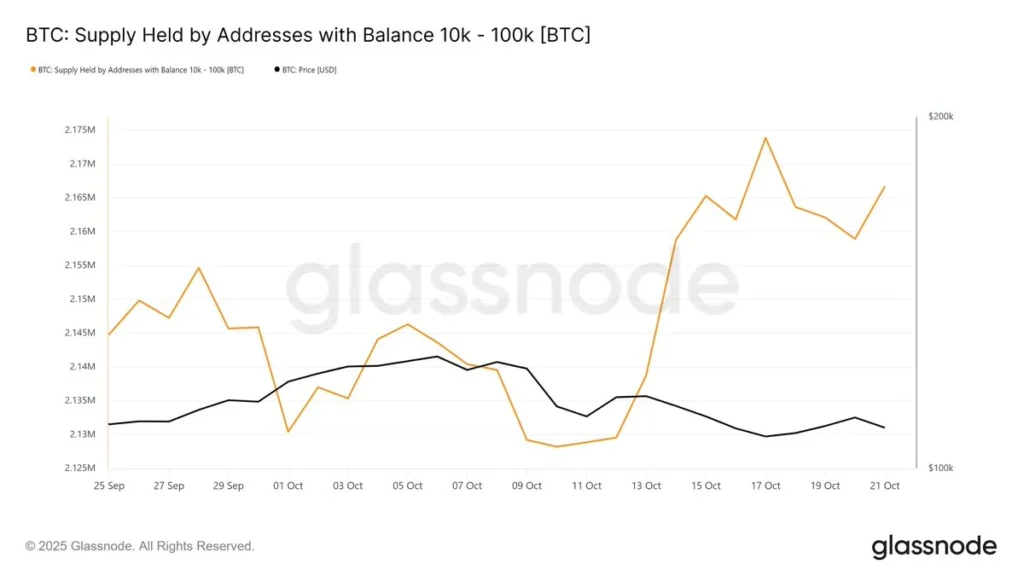
After the market crash on October 10, large Bitcoin holders—often referred to as whales—who each hold between 10,000 and 100,000 BTC, collectively added more than 45,000 BTC to their wallets.
This means that while many small investors (retail traders) were selling their Bitcoin out of fear, these big investors were buying more at lower prices. It’s a classic example of how institutional or large-scale investors often take advantage of market dips to accumulate assets at a lower cost, while retail investors tend to panic-sell during downturns.
In short, this behavior suggests confidence from big players in Bitcoin’s long-term potential despite short-term volatility.
Bitcoin ETF Data
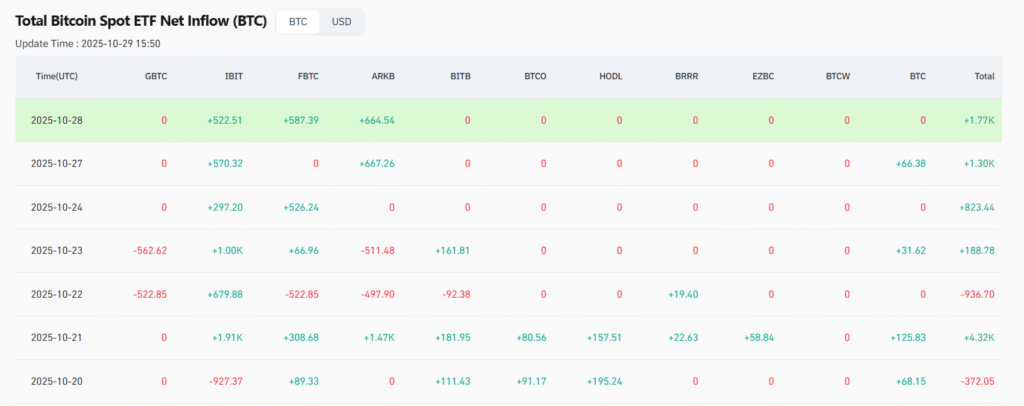
In the last four days, Bitcoin ETFs have recorded consistent positive inflows, meaning more investors are buying rather than selling. This is another bullish signal for the market. The renewed interest from ETFs and large institutional investors shows growing confidence after the October 10 market crash. One of the biggest buyers among these ETFs is BlackRock, further highlighting strong institutional demand for Bitcoin.
Market Volatility
As you know, today is the Federal Reserve’s interest rate decision day, one of the most important events for global financial markets. During such announcements, markets often become highly volatile, with sharp price movements in stocks, forex, and cryptocurrencies. Many traders and investors tend to panic when they see sudden fluctuations, but it’s important to stay calm and think logically.
Instead of reacting emotionally, wait for the official statement and press conference from the Fed to understand the full picture. Whether the rate is cut, raised, or kept unchanged, markets usually take some time to digest the news. Always analyze the data and expert opinions before making any investment decision. Remember, patience and discipline are key during major economic events like this.
Tracking Liquidity
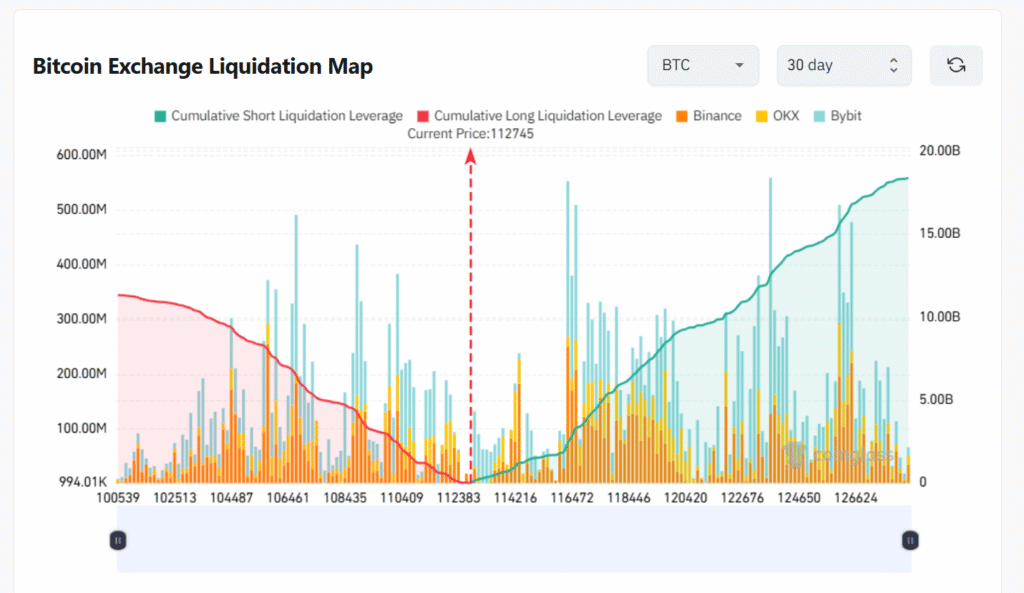
This Bitcoin Exchange Liquidation Map shows how leveraged traders have been affected over the past 30 days. The red line represents long liquidations, meaning traders who expected Bitcoin’s price to rise but got forced out as the market fell. The green line shows short liquidations, or traders who bet on the price going down and got liquidated when it moved higher. The colored bars (orange for Binance, yellow for OKX, and blue for Bybit) display liquidation activity across major exchanges.
At the current price of $112,745, we can see that earlier in the chart, long traders faced heavy liquidations during the market drop. However, as the price started to recover, the short liquidation line began to rise sharply — indicating that traders betting against Bitcoin are now getting squeezed out. This shift signals that buying pressure is increasing, and the market sentiment is turning bullish after the earlier correction. In short, big players seem to be re-entering the market while overleveraged shorts are being wiped out.
Bitcoin Technical Analysis
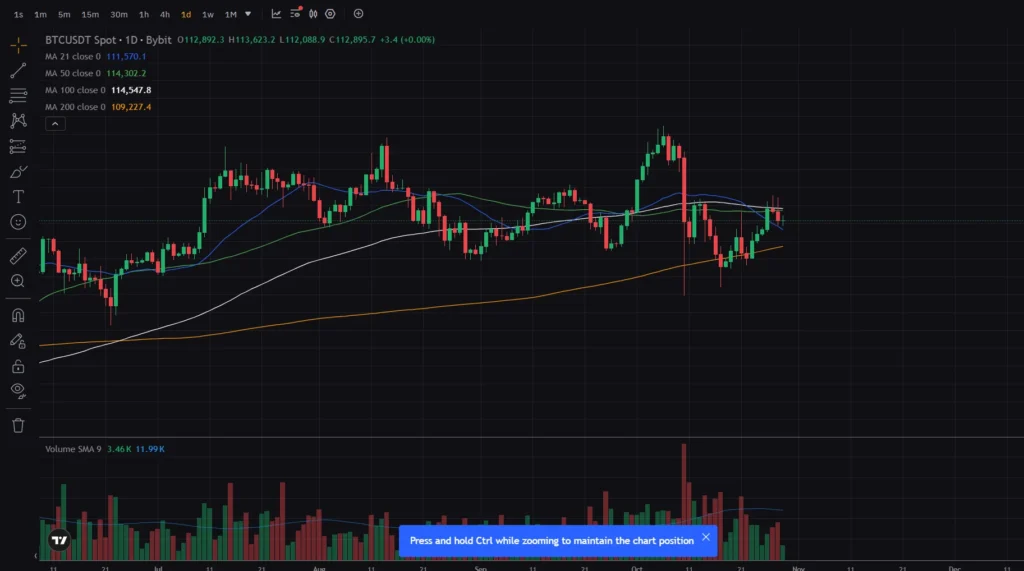
Bitcoin is currently trading between the 50-day and 21-day moving averages, showing short-term consolidation after the bounce from the October market drop. The 200-day MA (around $109K) acted as strong support during the recent pullback, and price rebounded from that level, a bullish sign.
However, BTC is struggling to break above the 50-day and 100-day moving averages, which are both sitting near $114K, forming a short-term resistance zone. If Bitcoin can close above this range with volume, it could confirm a bullish breakout and possibly push toward $118K–$120K next.
On the downside, if price fails to hold above the 21-day MA ($111.5K), a retest of the 200-day MA near $109K is possible.
Overall structure remains neutral to bullish, as long as Bitcoin holds above the 200-day MA and continues building higher lows.
Ethereum Technical Analysis
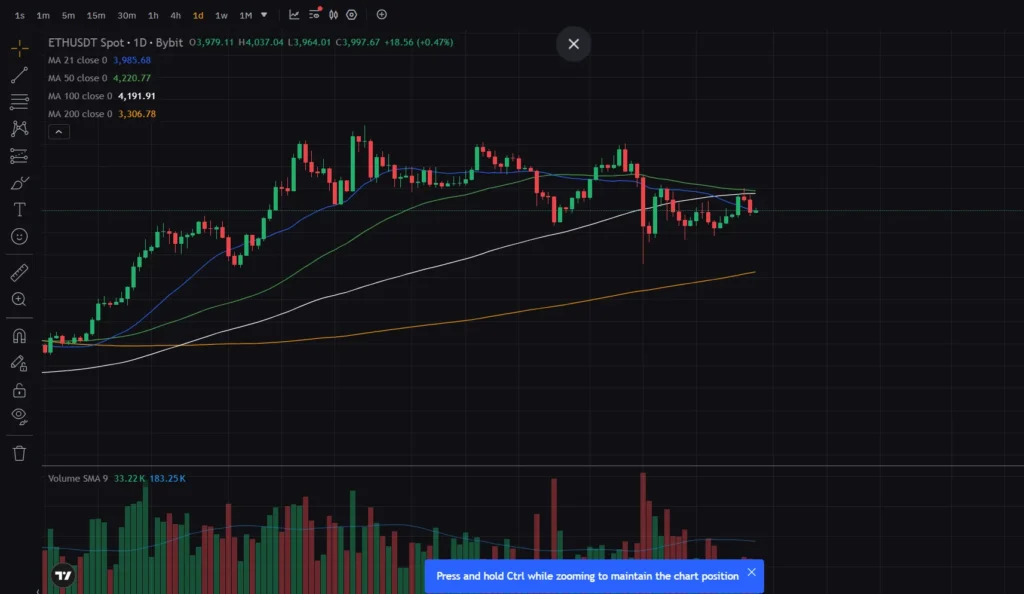
Ethereum is showing a similar structure to Bitcoin, but with slightly weaker momentum. ETH is currently trading just below the 50-day and 100-day MAs, which are both acting as resistance around the $4,200 zone. The 21-day MA is providing near-term support at around $3,985.
ETH is currently forming a tight consolidation pattern — possibly a symmetrical triangle, with lower highs and higher lows converging. A decisive breakout above $4,200 could open the door for a move toward $4,400–$4,500, while a breakdown below $3,900 may drag the price toward $3,700–$3,600.
The 200-day MA around $3,306 remains a strong long-term support level, and the overall trend stays bullish in the medium term as long as ETH holds above it.
Related Content
- Top 10 Companies Holding the Most Bitcoin in Their Treasury (2025 Update)
- Bitcoin Mining Explained: From Its 2009 Beginning to How It Works Today
- 10 Reasons Why Bitcoin Is Often Called “Digital Gold”
- Best Places to Safely Store Your Bitcoin in 2025
Conclusion
The S&P 500 reaching a new all-time high just before the U.S. interest rate decision highlights growing optimism in financial markets. Investors are anticipating a positive outcome from the Federal Reserve, and this sentiment is spilling over into the crypto market as well. If the Fed cuts rates as expected, it could fuel further rallies across equities, forex, and digital assets, signaling renewed risk appetite among traders and institutions.